
I'm
Ricardo Carli
Data Analyst, BI Analyst, Data Analytics

Post-graduated in Data Engineering. Advanced English. Over 7 years of experience delivering scalability through cloud data structures, machine learning solutions, and business intelligence. Advanced expertise in SQL and Python, modern data warehouses (BigQuery), cloud ETL/ELT pipelines, and advanced analytics via MS Power BI, Streamlit, and Excel to drive workplace automation and strategic business forecasting.
Creative professional, self-taught, love working with data and lover of challenges (and I MEAN it). Over six years working with data. Good analytical skills and knowledge of technologies, often allowing me to contribute with effective solutions to business problems.
Lover of travelling, animals, sports and meditation. I consider myself determined but also empathetic, prioritizing kindness and cooperation in personal and professional relationships. I don't carry any prejudice and also believe that by doing my part I contribute to the whole.
PUC Minas | 2023 - 2024
2023/January until 2024/July.
Universidade do Leste de Minas Gerais | 2013 - 2018
2013/July until 2018/July
Capgemini | June/2024 - Present
International experience using English as the main language, creation and upgrade of dashboards. Row-level security, general Power BI reports, Power Query and DAX performance tuning, executive summaries using Power BI and AI API. Upgrade on premise environment into MS Fabric environment. This role demonstrates proficiency in remote and multicultural work environments, as well as expertise in data visualization.
Fundação São Francisco Xavier | 2020 - 2024
Strong experience in creating and optimizing ETL processes using SSIS, as well as developing Data Warehouses and Data Marts. Full-cycle skills, from gathering requirements to delivering dashboards in Power BI. Experience with SQL for complex data extraction.
Freelancer | 2018 - Present
Build data solutions for business problems, close to real challenges of companies, using public data from competitions. While developing the projects, I approache the problem from the conception of the business environment.
Fundação São Francisco Xavier | 2019 - 2020
Data governance and KPI analysis, creation of dashboards with Power BI and MS Excel, and the application of descriptive statistics for data analysis. Experience in data processing using Python, with widely recognized libraries.
Fundação São Francisco Xavier | 2018 - 2019
Financial data analysis and civil engineering sector data analysis, focusing on data extraction and processing using Python and creating informative dashboards. Strong skills in Excel and Power BI for data visualization.
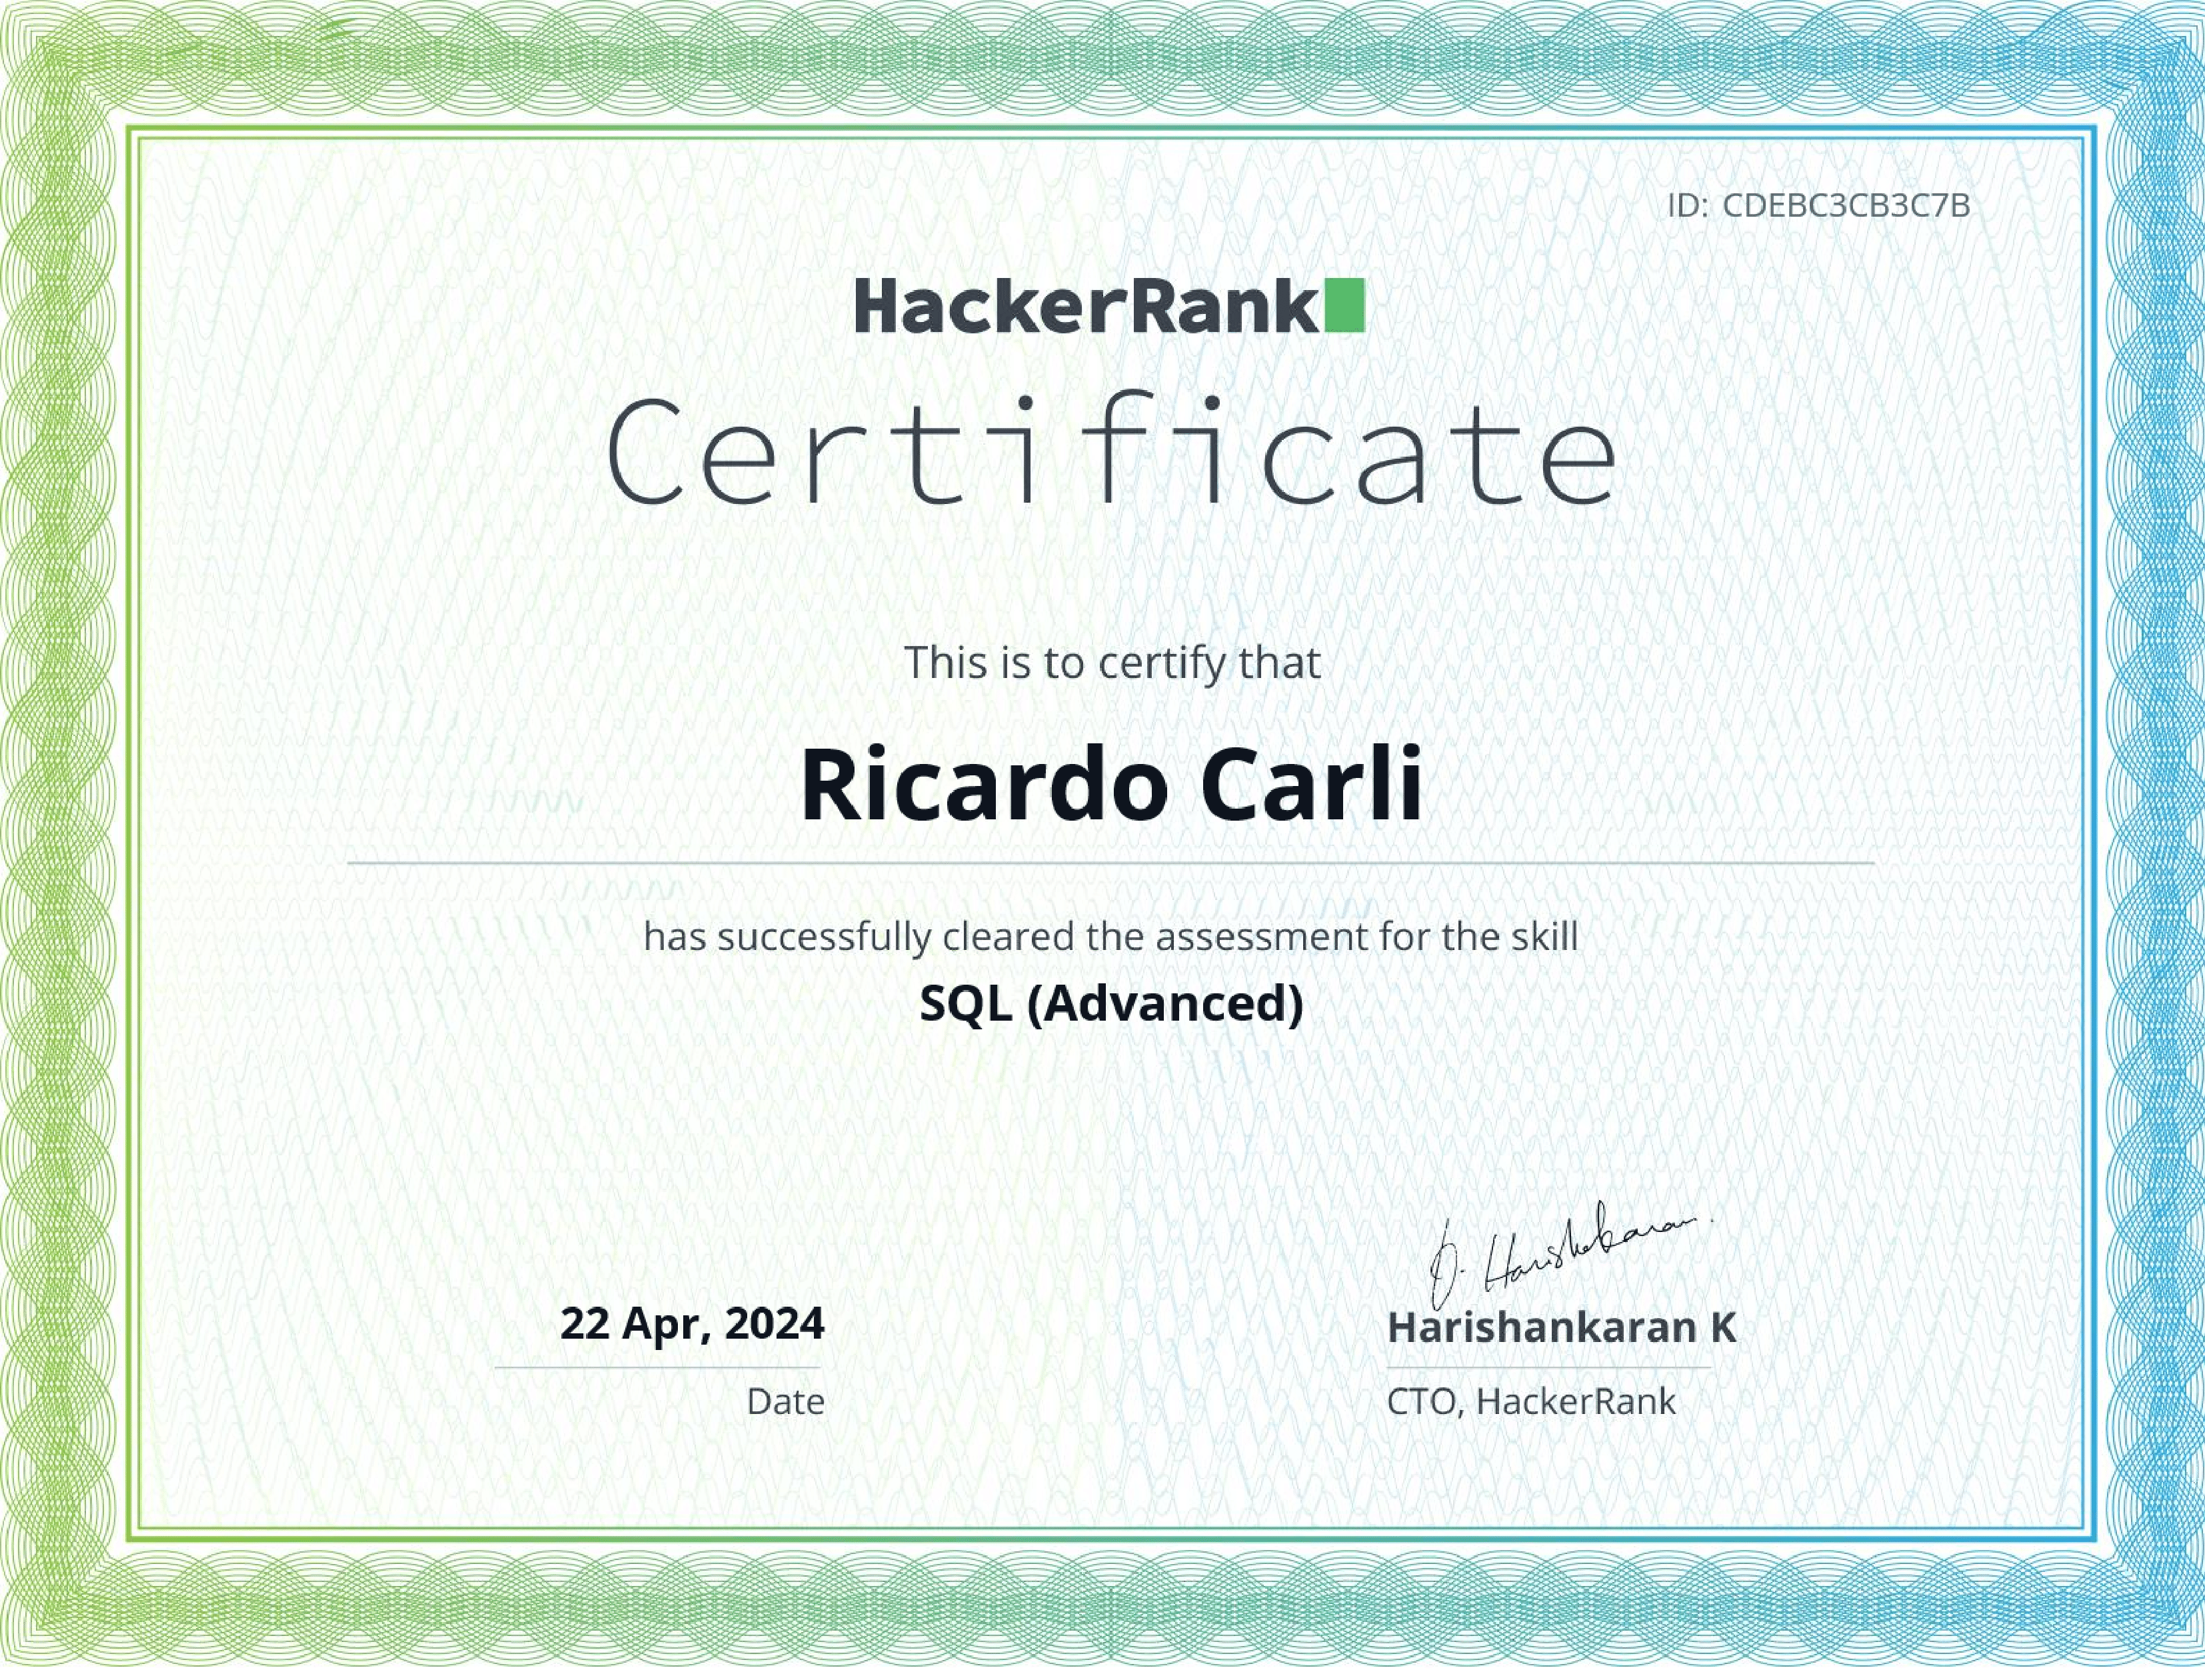
The Advanced HackerRank Certificate signifies a comprehensive mastery of advanced SQL coding techniques and problem-solving skills. It is conquered through solving complex coding challenges, implementing optimized algorithms, and effectively utilizing advanced data structures.
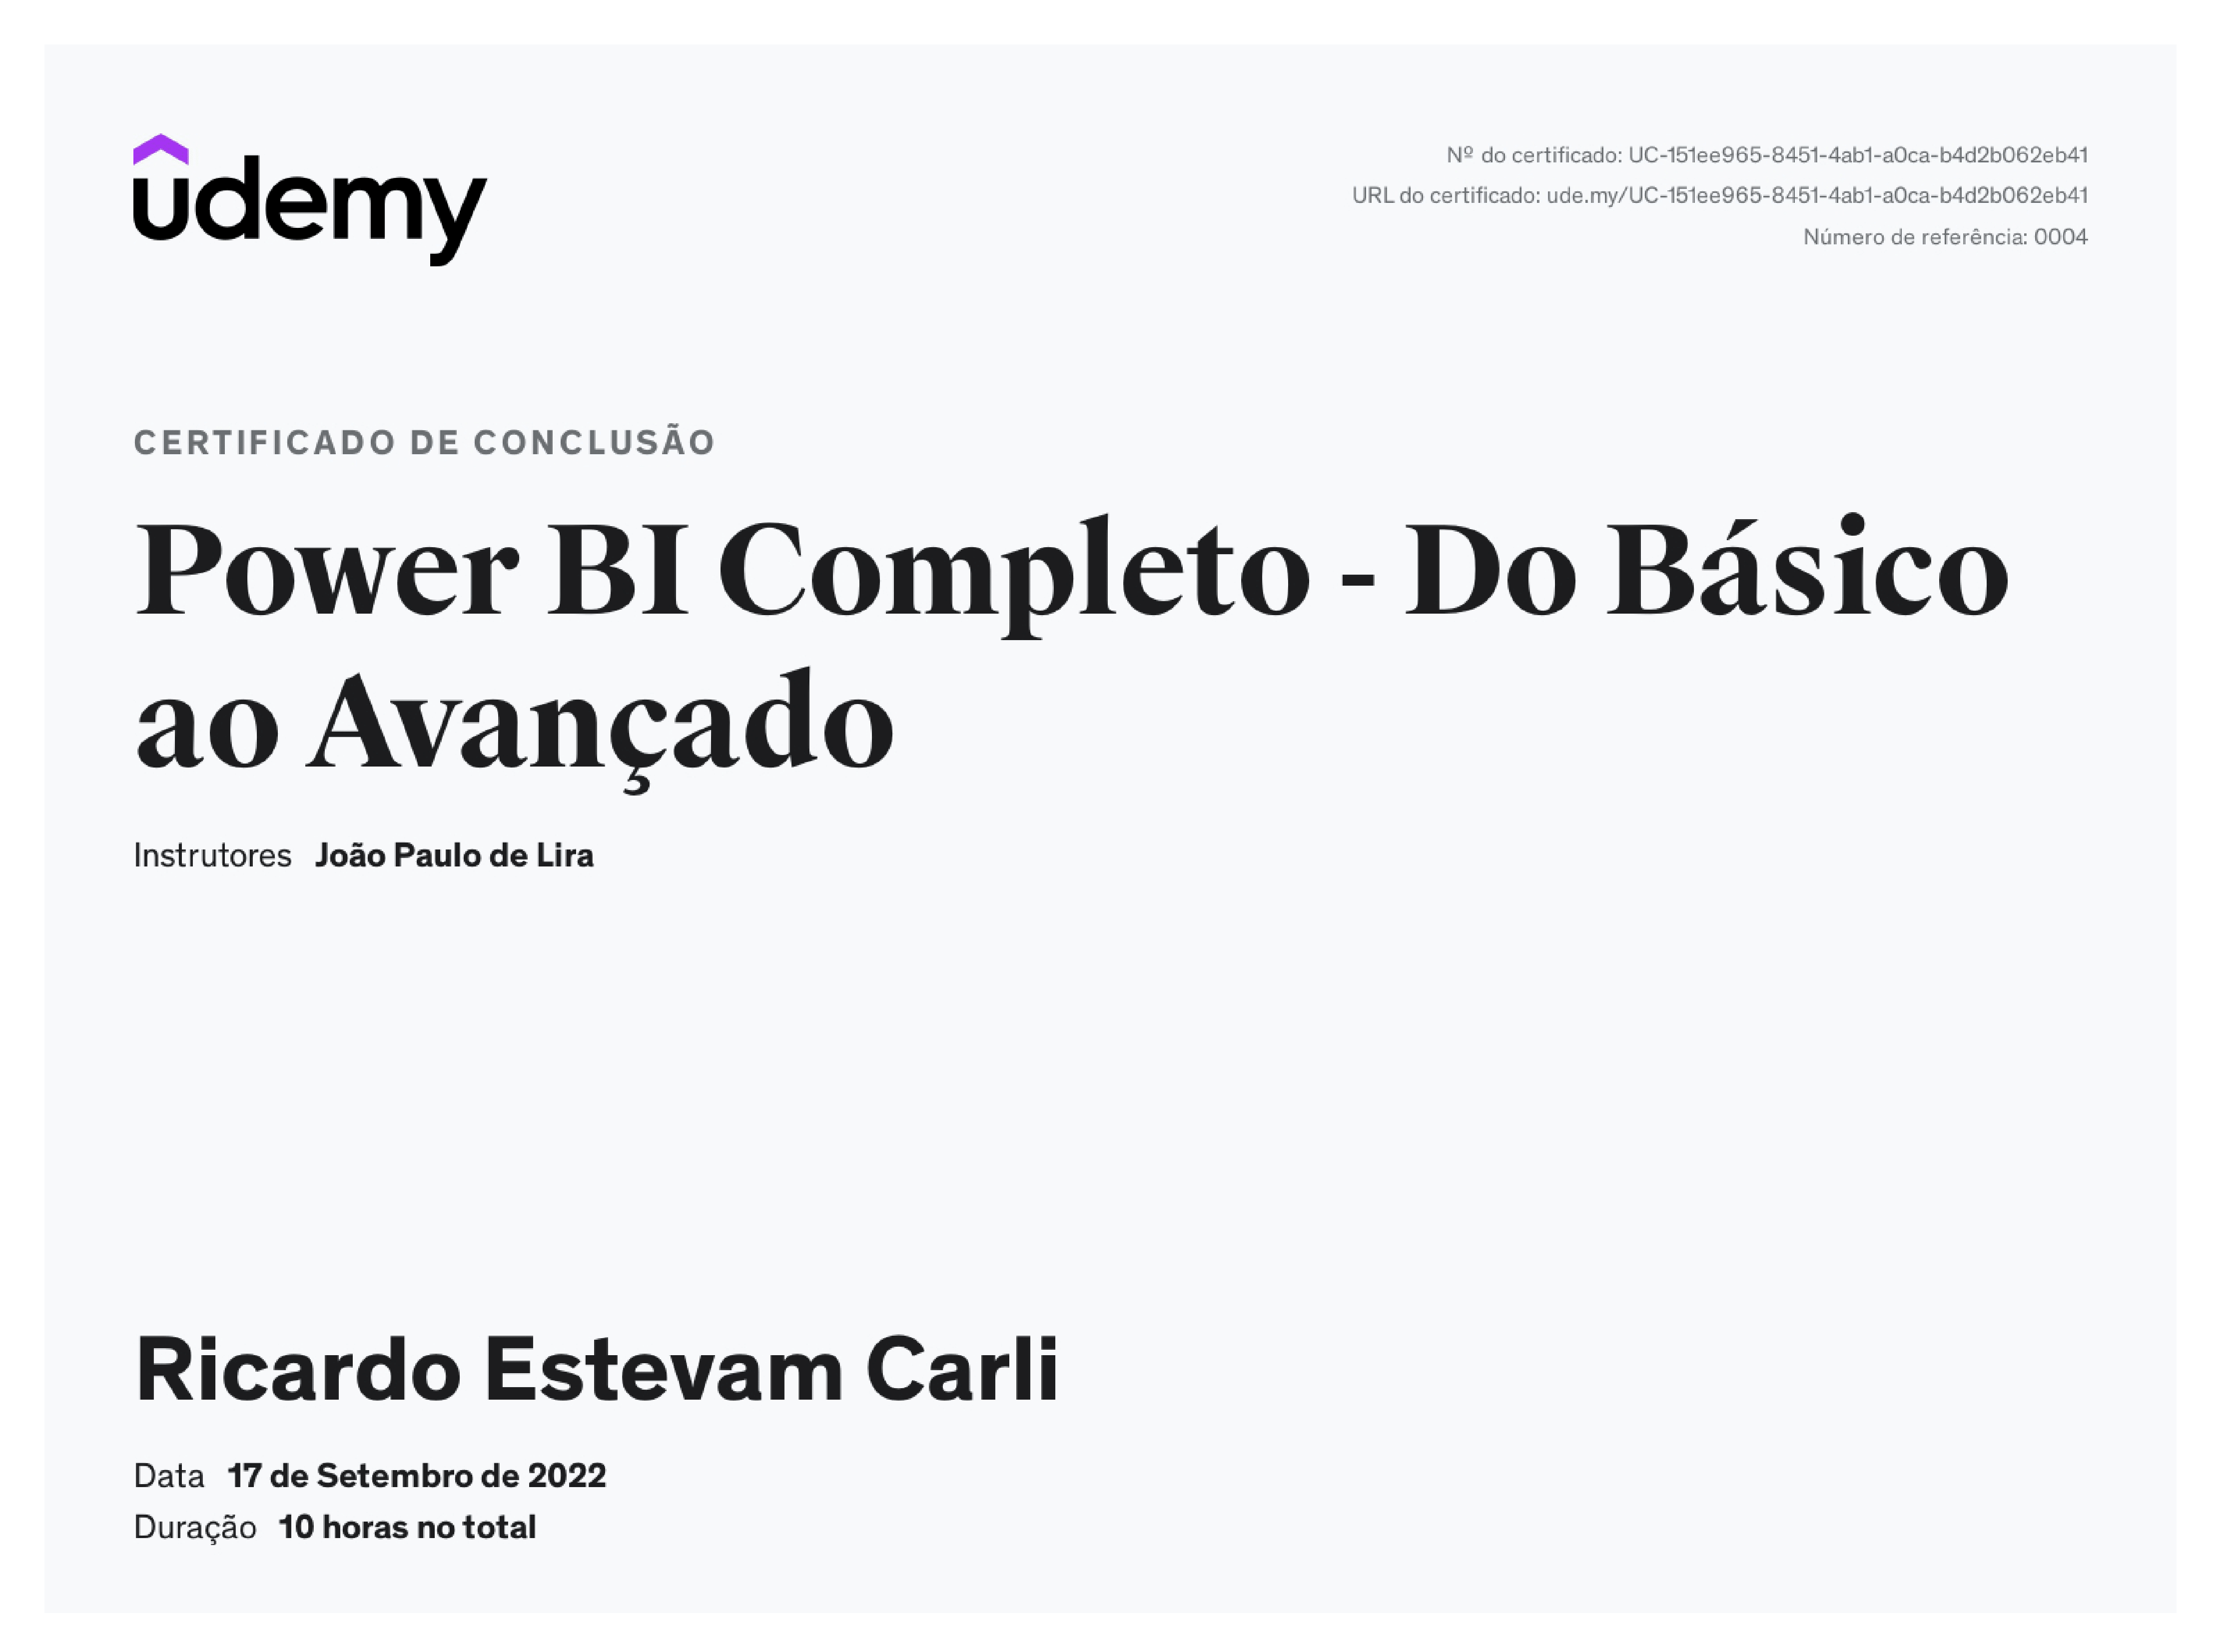
In-depth data modeling, advanced DAX functions, complex data visualization, and transformation of raw data into actionable insights for career advancement.

Advanced Python focusing on data science and machine learning. Covers advanced data manipulation, feature engineering, and model optimization.
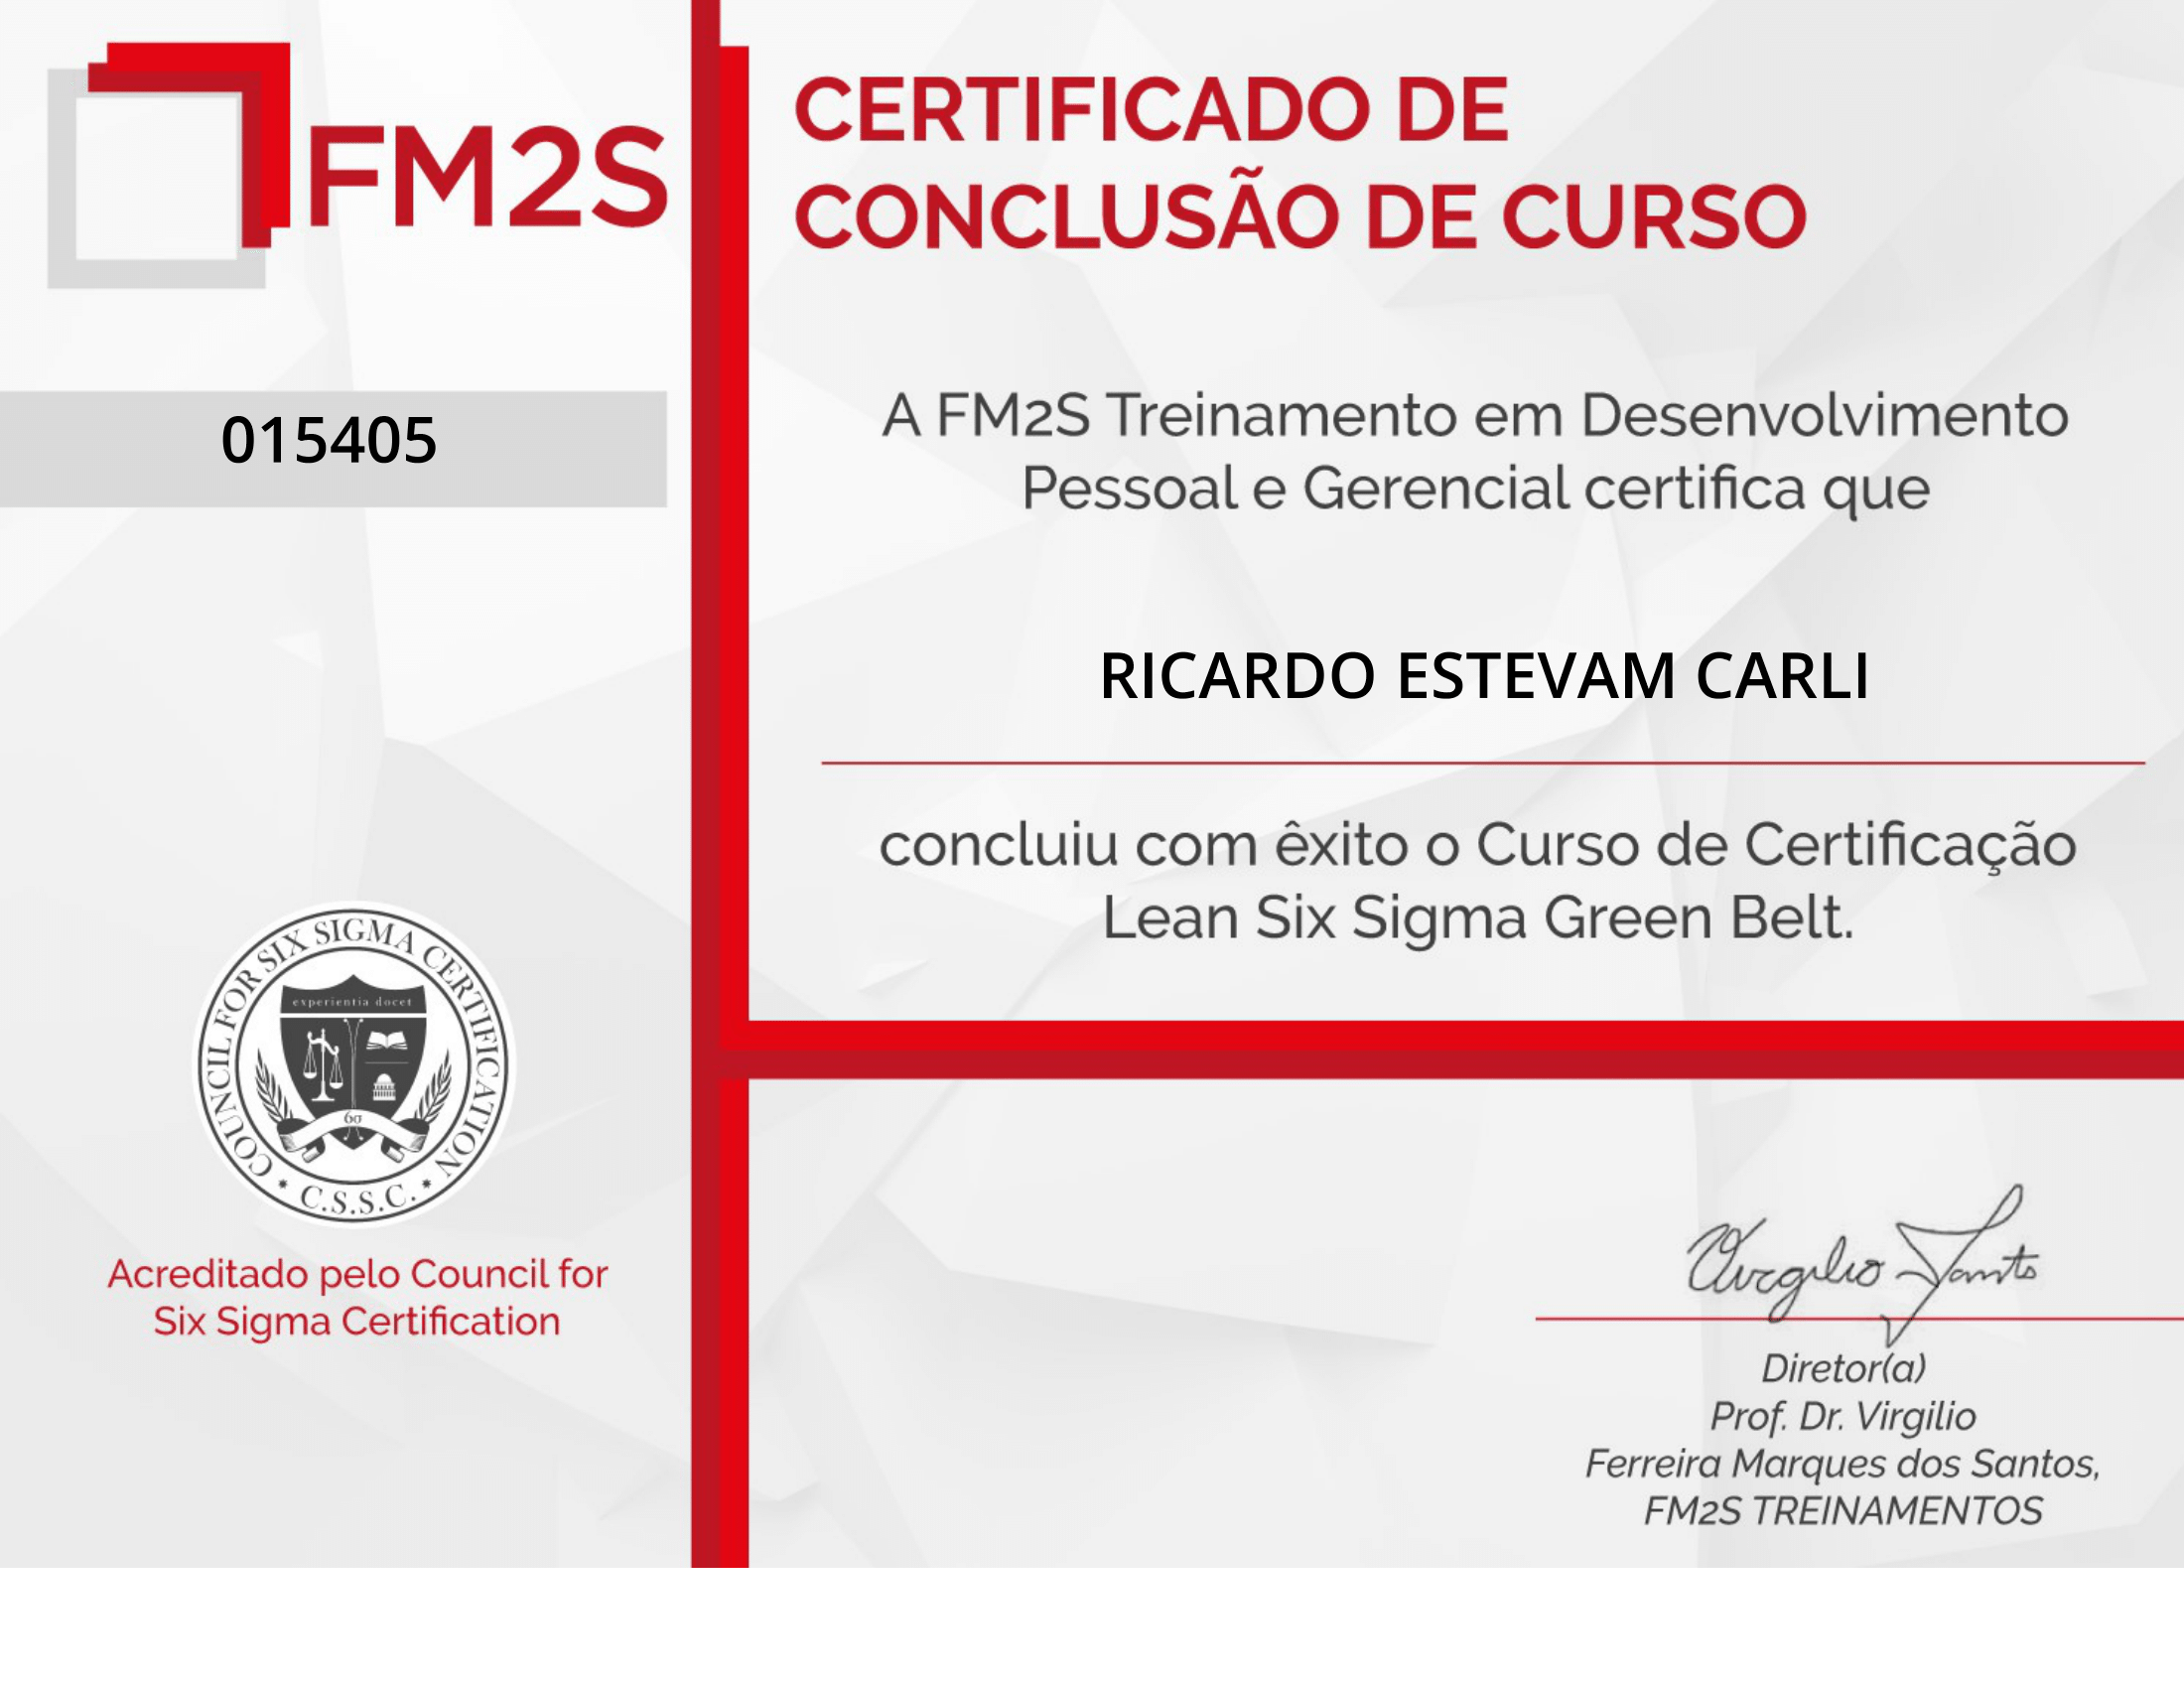
The Green Belt Six Sigma equips professionals with intermediate-level skills to lead process improvement projects, using data-driven methods, and contributing to a culture of continuous improvement. The FM2S Certificate is internationally recognized by Council for Six Sigma.
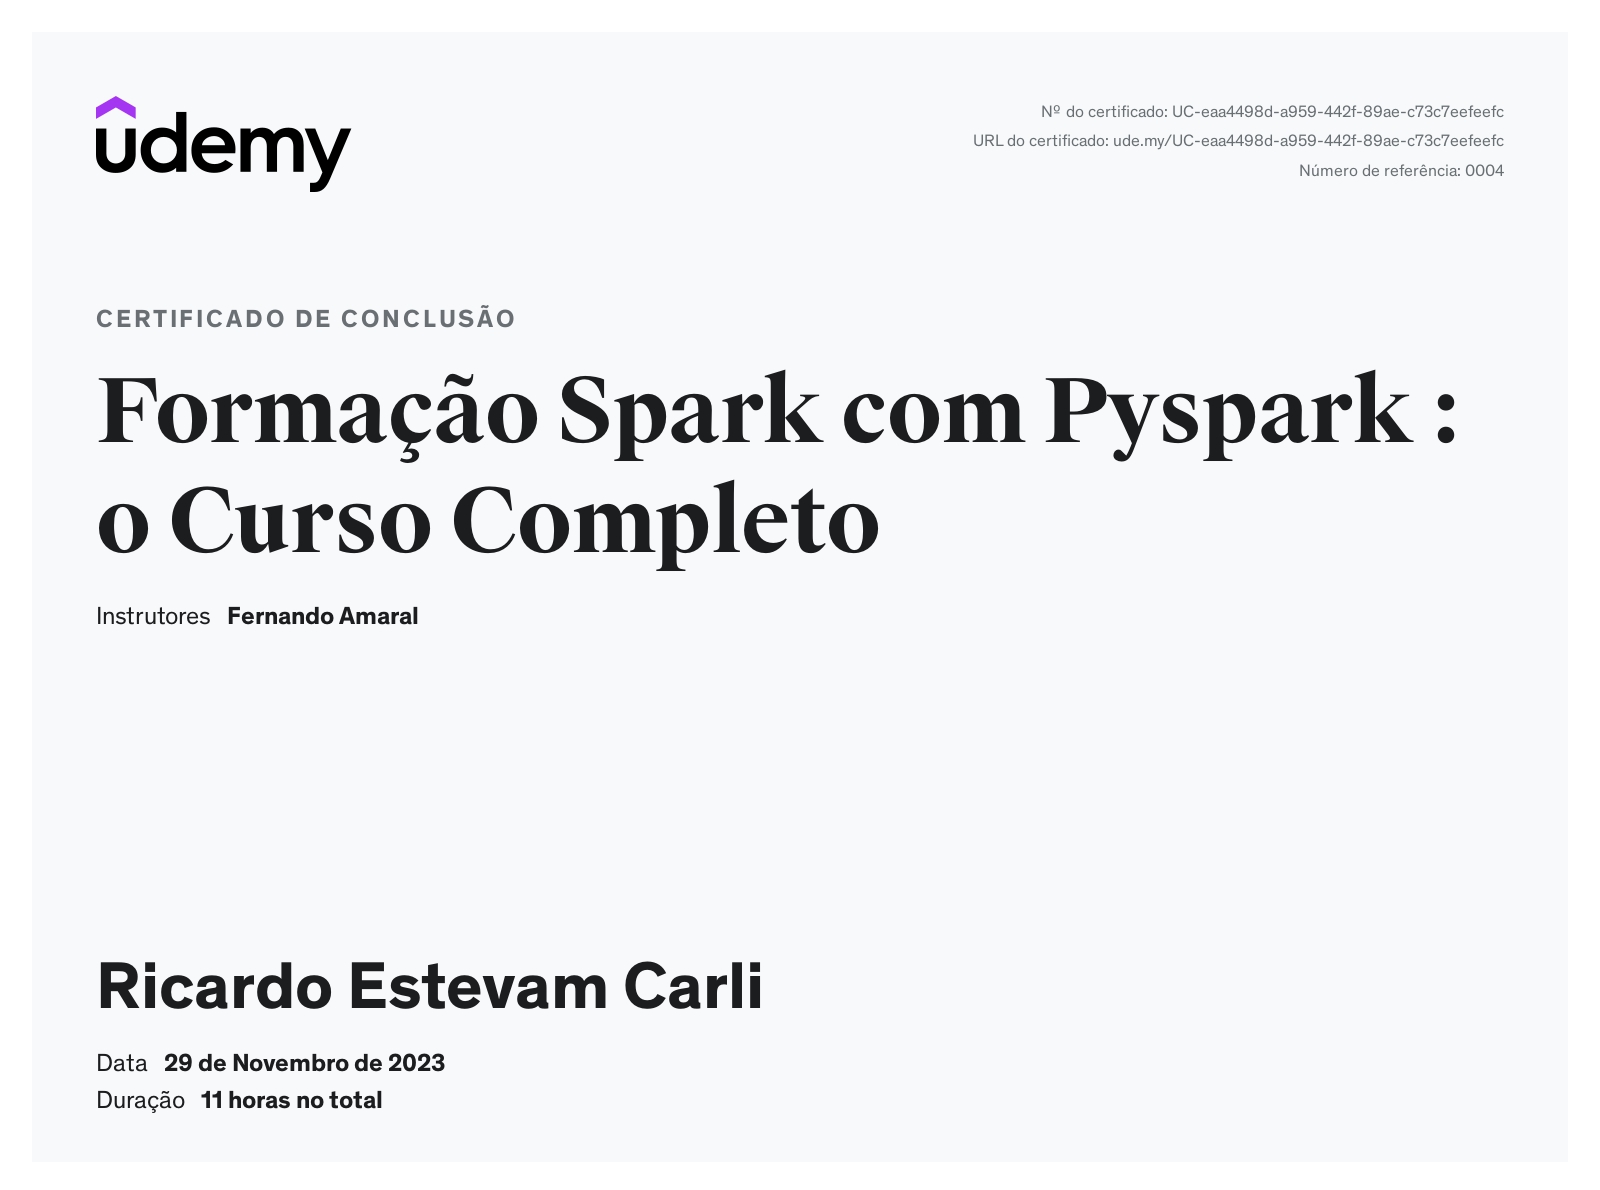
PySpark is crucial in ETL for its ability to handle large-scale data processing efficiently, leveraging distributed computing capabilities to transform and extract data swiftly from diverse sources with ease.
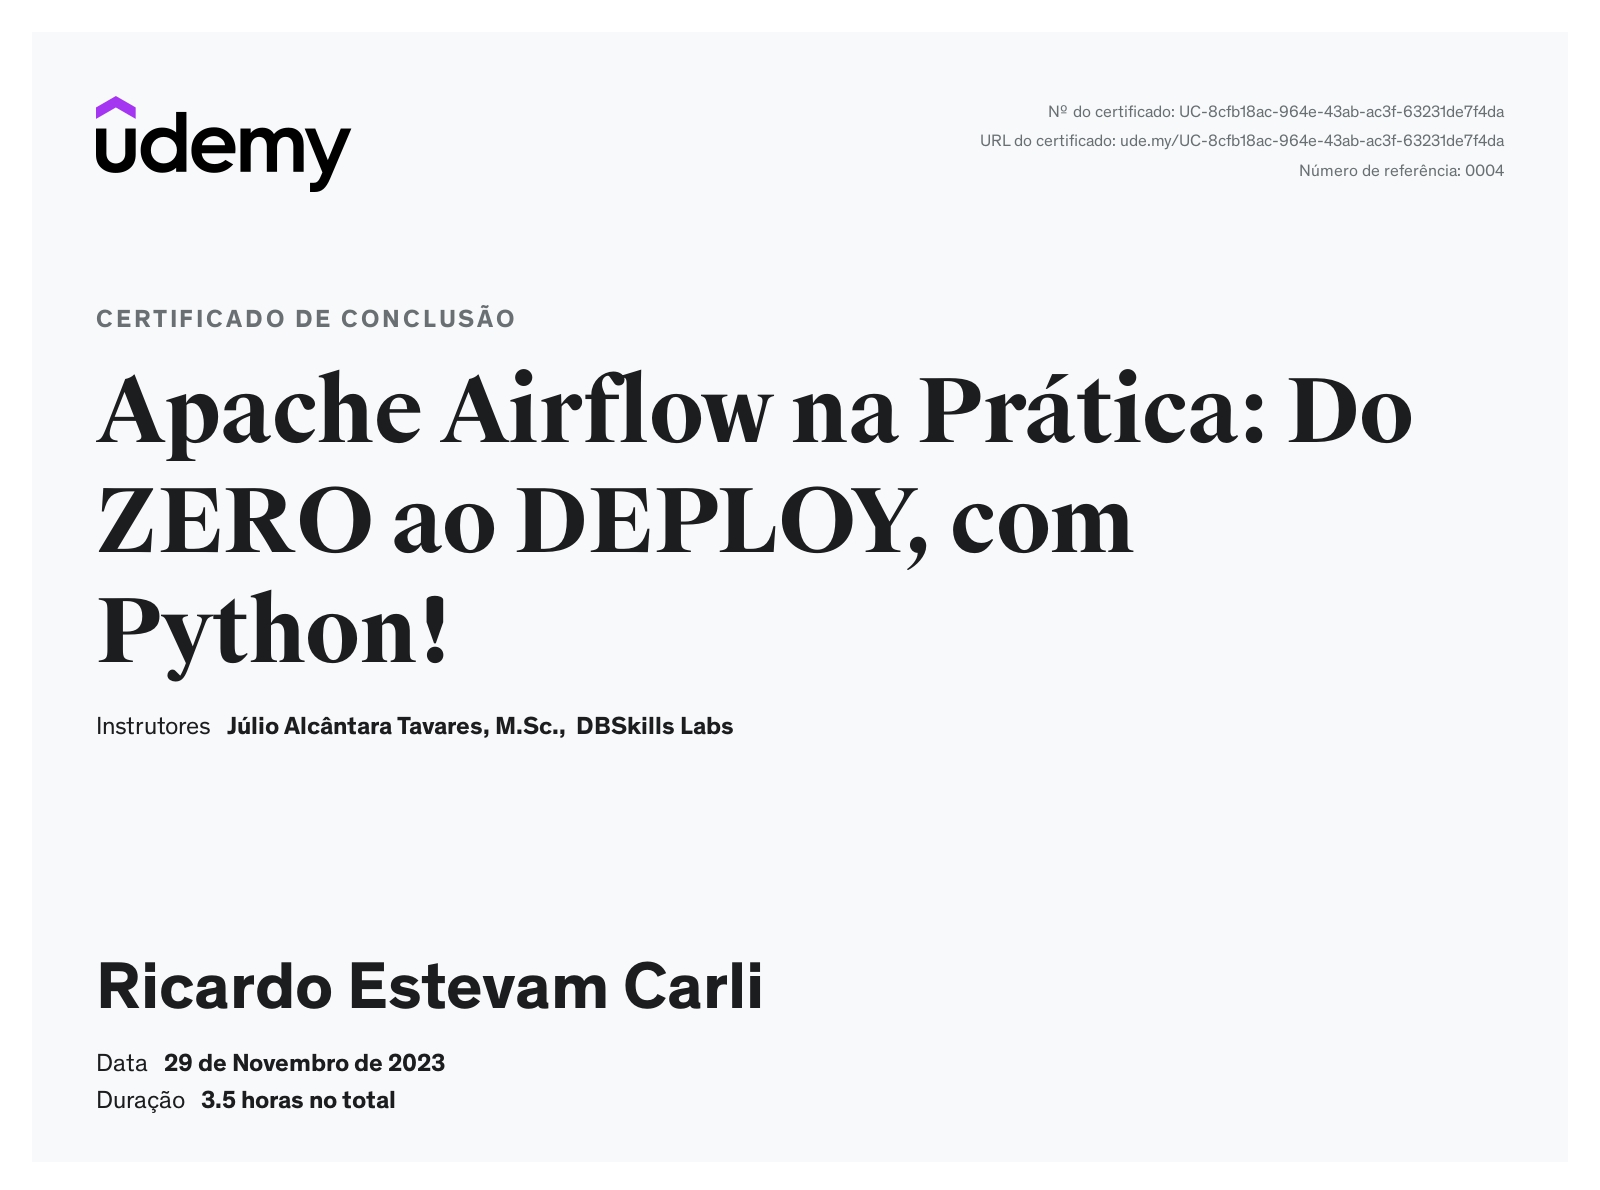
Apache Airflow is a powerful platform used to workflow orchestration and scheduling, empowering automate complex processes with ease.
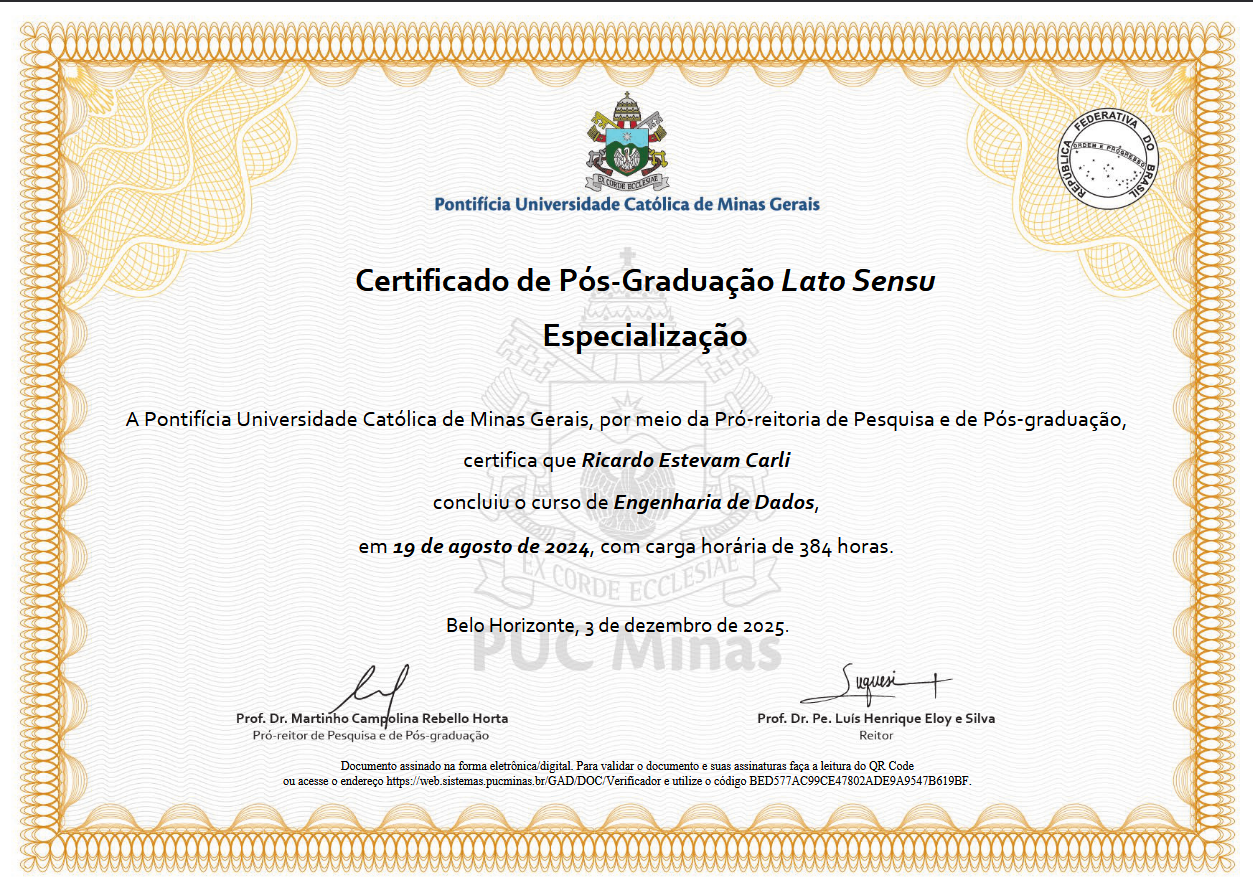
This specialization provides deep expertise in the data lifecycle, covering distributed computing, data warehousing, and real-time streaming. It masters the integration of diverse data sources using Python, SQL, and cloud environments (AWS/Azure/GCP), ensuring data integrity, security, and high performance across the entire organizational infrastructure.
Tools used:
#python #pandas #seaborn #heroku #streamlit
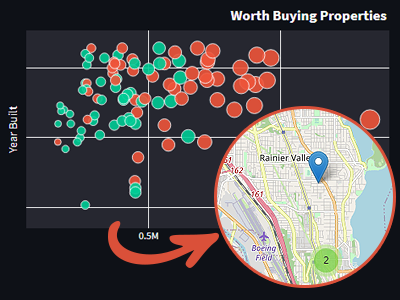
The objective of this project is to identify properties listed below the market average price and assess their potential for renovation and resale. Using Streamlit for data visualization, it presents relevant metrics through charts and interactive maps, allowing users to estimate potential profits after refurbishing properties.
Tools used:
#machinelearning #python #pandas #xgboost #telegram #bot
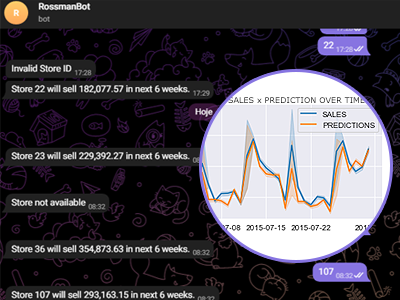
This project aims to predict sales values for various stores using a regression model (XGBoost). The results are delivered through an API, which integrates with a Telegram bot to provide real-time updates on predicted sales, making it easier for stakeholders to access critical information.
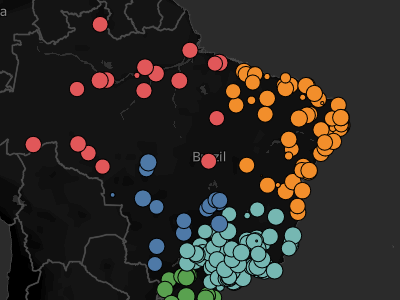
#tableau #datashboard #dataviz #visualization
This data visualization project provides a comprehensive overview of sales and profits segmented by state and region in the financial products sector. The Tableau dashboard presents key performance indicators in an interactive and accessible format, allowing for deeper insights into regional performance trends.
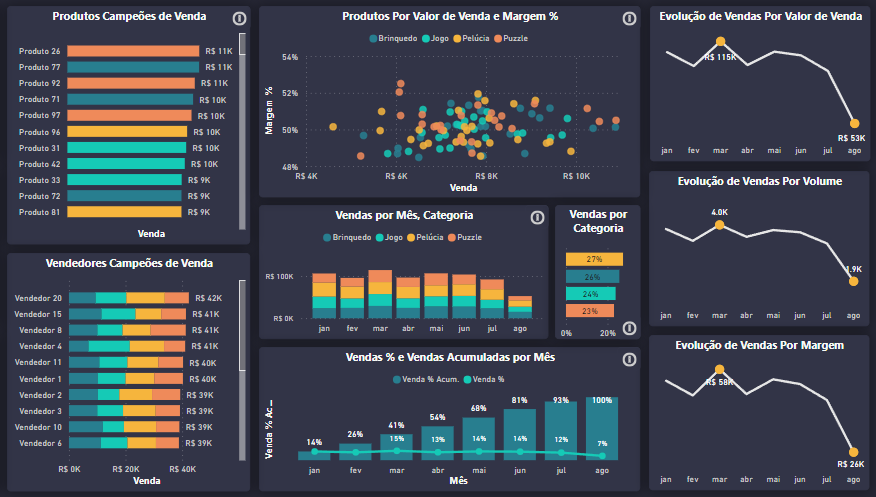
#powerbi #dashboard #dataviz #visualization #analysis
This project presents a dashboard created in Power BI to visualize sales performance. It allows users to easily assess store performance by different metrics, offering key insights through interactive charts and graphs.
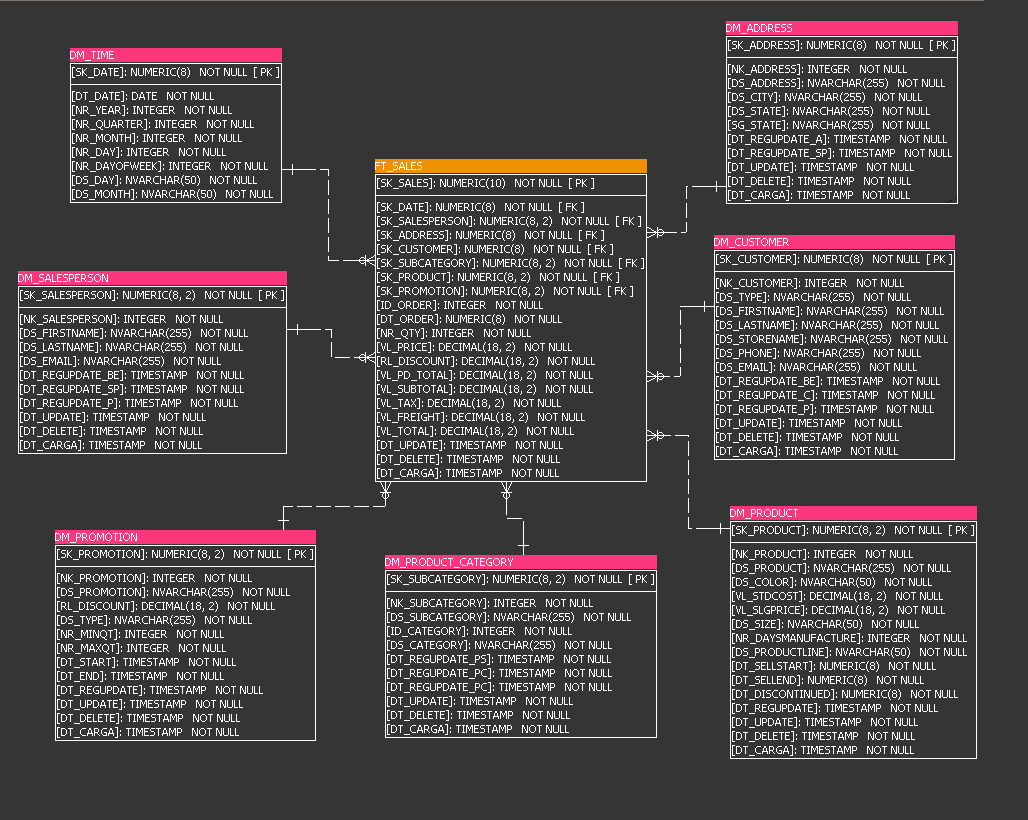
#ssms #sqlserver #ssis #visualstudio
The main goal of this project is to create a dimensional model to organize and analyze sales data effectively. Utilizing SSIS and SQL Server, the project focuses on building a reliable data pipeline for extracting, transforming, and loading data, ensuring better scalability for analytical processes.
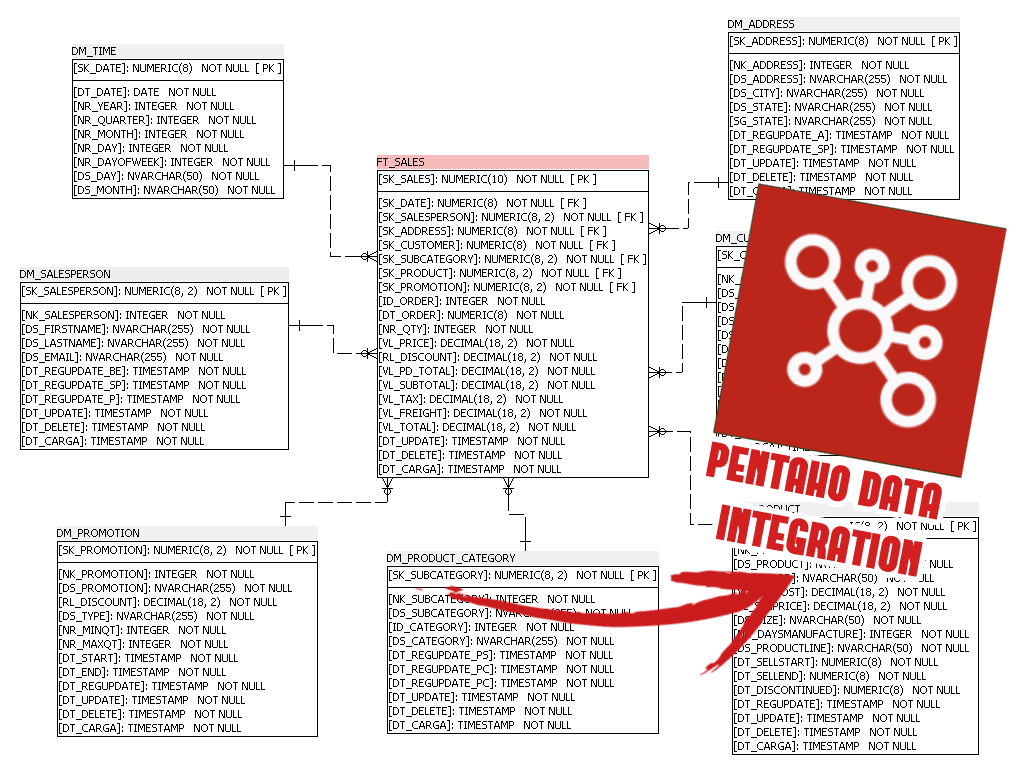
#pentaho #mysql #etl #bi
The project employs Pentaho for ETL and dimensional modeling to efficiently process sales data. This setup ensures streamlined data flows and provides the basis for robust business intelligence reporting and analysis.
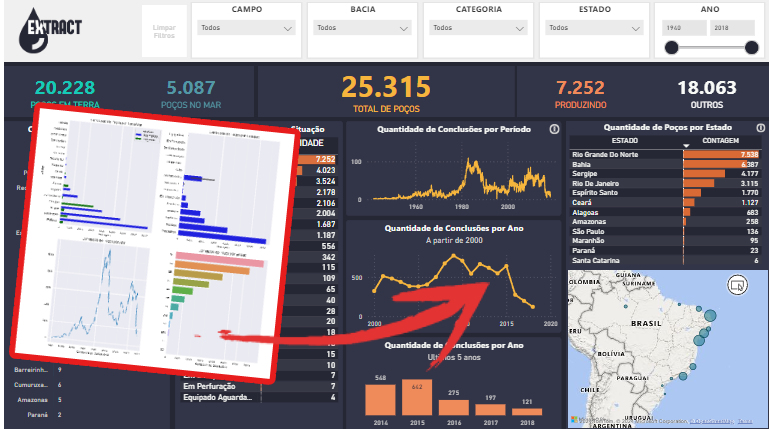
#powerbi #python #pandas #matplotlib #dashboard #dataviz #visualization #analysis
This project focuses on analyzing oil extraction data through Python and Power BI. The dashboard visualizes the relationship between producing and injecting wells, offering insights for decision-making in the management of resources.
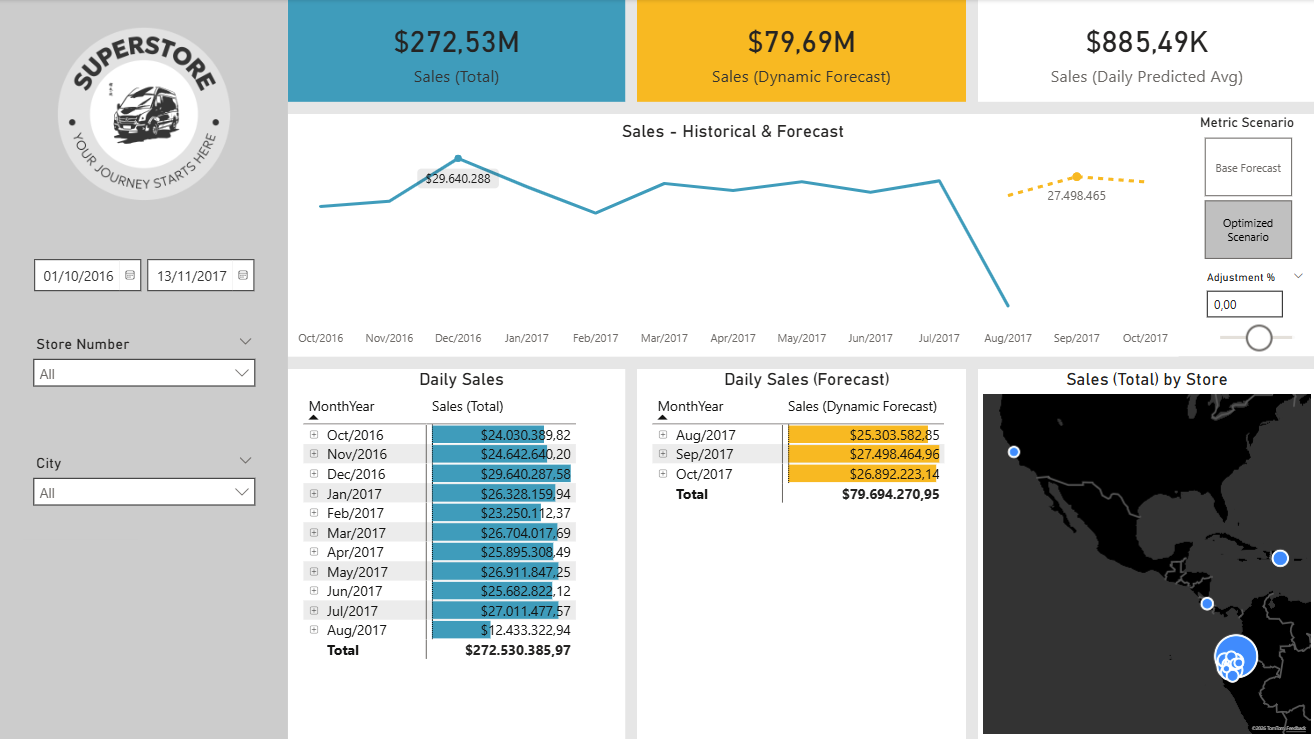
Tools used:
#AI #PowerBI #BigQuery #MachineLearning #GCP #BusinessIntelligence #DataAnalytics #Forecasting
This project delivers an end-to-end predictive solution for automotive retail sales. Using Google Cloud (GCP/BigQuery ML) and Python, it integrates a 90-day Machine Learning revenue forecast into a dynamic Power BI dashboard to guide strategic financial decision-making.
(this actually works)
© HTMLCodex Domain. All Rights Reserved. Designed by HTML Codex